


Some time back I heard of a group of people on the internet who were spending their time creating graphs of songs titles and lyrics and posting them online – in fact there was a whole song chart pool on Flickr that was collecting them all. As a closet geek with a passion for music, the idea appealed to me hugely and I found myself laughing out loud at a couple. Some stood out for me particularly – here are two:


(If you don’t get them, then feel free to choose another exciting post on this blog to read; the rest won’t make that much sense to you!)
Anyway, at the time I thought it would be fun to create a couple and I promised myself that when I had time I would give it a stab. That was a year ago and I finally got round to doing it. So here are a couple of my own (in the interests of bandwidth I won’t include them all here — the rest you can see on www.tonylankester.com):


And a slight variation on this last one, for local flavour:

Author

A prince with dignity and determination
Prince Ngarambe’s goals are to become Rwanda’s first transgender model and to uplift the country’s youth
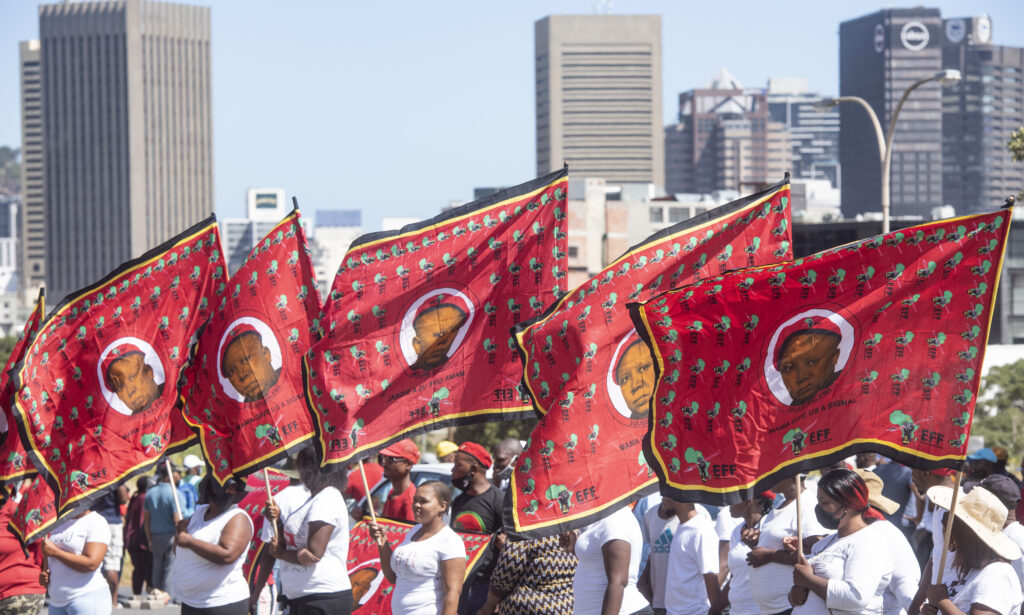
The EFF’s principles are unshakeable
Unlike the ANC, the core values of the freedom fighters do not change with each leader it elects